So, I was thinking that it would be a good idea for us to do the same task in a single thread. This could help us opening our minds to new ways of presenting the given data. A lot can be learned I believe from seeing others do the same task you yourself have done. You get to learn about many details that you have missed or better ways to express. Join in if you think this can be of help.
There are no time constraints but try doing this in 30 minutes or less. It would be better if you write your own answer first without reading how the others have done it.
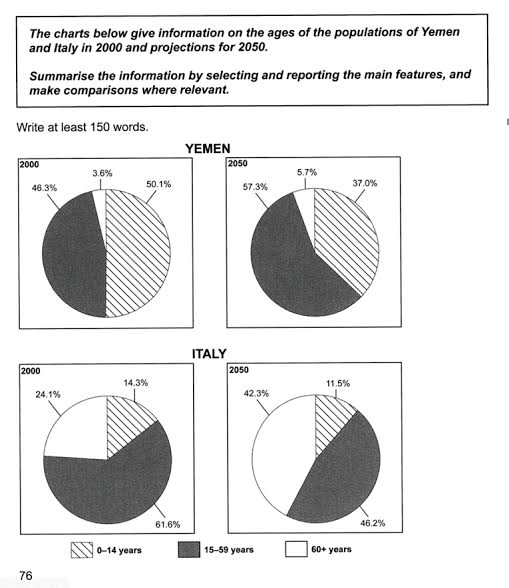
The given pie charts provide an overview of the percent share of various age groups in the total population of Yemen and Italy in the year 2000. The second pie chart makes predictions for the year 2050 regarding the same.
Taking a closer look at the Pie chart relating to Yemen it is evident that adolescents below the age of 14 hold the biggest share of the population at 50%. Age group 15 to 59 follows closely with a share of 46%. People above the age of 60 constitute a mere 3.6% of the total population. The predictions regarding Yemen for the year 2050 project age groups 0-14, 15-59 and 60+ at 37%, 57% and 6% approximately, respectively.
Moving on to the pie chart relating to Italy, it can be seen that the age group between 15 to 59 years forms a large part of the population at 61%. While people above 60 years of age form about 24% of the population, those below the age of 14 form just 14% of the same. The predictions for year 2050 for Italy pose the population to be consisting 11%, 46% and 42% of the total population for the age groups 0-14. 15-59 and 60+, respectively.
Analyzing Pie Chart predictions of both the countries we can see several trends emerging. Let us begin with Yemen. According to the predictions Yemen will experience a 10% rise in Adult population by 2050 as the adolescent population drops 13% of the share of population. The elderly population will gain a mere 2% over the 50 year course. A for Italy, It is expected to experience a strong decline of over 15% in the adult population while the elderly population is expected to double itself in the same 50 year time period from 2000 to 2050. Adolescent population may see a moderate decline of about 4%.
To conclude then it can be stated that both the countries are expected to have a decrease in the number of adolescents and an increase in the number of elderly people. The adult population is projected to rise in Yemen but to drop down in Italy.
The pie charts illustrate the percentage of population in different age groups in Italy and Yemen in 2000 and 2050.From an overall perspective it is seen that major percentage of population is formed by young adults in these years.
In Yemen, young adults i.e people of 15- 59 years of age comprised 46.3 % of population in 2000 and this will increase to 57.3 % in 2050. The major share of population is formed by children aged 0-14 years in 2000, at 50.1 % and this will decrease to 37 % in 2050. Senior residents i.e people more than 60 years of age comprise 3.7 % and 5.6 % of the population in 2000 and 2050 respectively.
In Italy, nearly two-thirds of population i.e 61.6 % is formed by young adults in 2000 and this figure will decrease to less than half i.e 46.2 % in 2050.When this data is compared with Yemen it is obvious that population of young adults in Yemen will show an upward trend contrasting to the downward trend in Italy. Interestingly the figure for senior residents almost doubled from 24.1 % in 2000 to 46.2 % in 2050. This trend also negatively correlates with the trend for senior residents in Yemen. Children comprise 14.3 % and 11.5 % of the population in Italy in 2000 and 2050 respectively.
It is concluded that the figures for population of various age groups in Yemen and Italy show opposite trends to each other in these years.
I just went through your report after submitting mine , and I realized that my report is exquisitely simple as compared to yours. Your writing is great. I hope I can improve on mine.
I just went through your report after submitting mine , and I realized that my report is exquisitely simple as compared to yours. Your writing is great. I hope I can improve on mine.
Candy
Nothing to worry about. You will only improve.
I was actually keeping the format that a a former IELTS examiner suggested. The suggestion was to write a longer (above 300 words) graph report if I want to score 8.5 or 9. The structure suggested is -
Introduction ( Single Paragraph)
Data information ( 2 to 3 paragraphs)
Data Analysis (Single paragraph)
Conclusion ( single paragraph)
The four pie charts illustrate information regarding the people in Yemen and Italy. They show the change in the ages of populations in 2000 and 2050.
It is safe to say that Yemen had an impressive 96,4% total in the younger groups in 2000. Only 3,6% of the population were over 60. At the same time, Italy’s senior citizens consist of a respectable 24,1% of the country’s population. The juvenile population gets the 14,3%, quite low compared to the same age group in Yemen. The majority of Italians back in 2000 were between 15-59 years old, taking the 61,6% of the pie chart.
The estimation for 2050 shows that the age of the population in both countries will see a significant change. In Yemen, the 15-59 age group will increase about 10% compared to 2000 and reach 57,3% of the overall population. The youngest population will go down about 13%, while the percentage of the oldest ones will almost be stable. In Italy, the most active part of the population will see a massive decline of about 20% in 2050. The population over 60 will double their percentage of 2000. Also, the Italian youngsters will be part of only the 11,5% of the population.
In conclusion, Italy’s population will grow old and the young population will decline. On the other hand, young Yemenis will see a rapid increase in the future.
candy07 wrote:The pie charts illustrate the percentage of population in different age groups in Italy and Yemen in 2000 and predicts the same for the year 2050.From an overall perspective it is visible/clear/evident that major percentage of population is formed by young adults in these years. ( you are overusing passive voice which sounds a bit odd. You could easily have said "..young adults form the major part in percentage of the population.)
In Yemen, young adults i.e people aged between 15- 59 years of age comprised 46.3 % of population in 2000 and this will increase to 57.3 % in 2050. The major share of population is formed by children aged 0-14 years in 2000, at 50.1 % and this will decrease to 37 % in 2050. Senior residents i.e people more than 60 years of age comprise 3.7 % and 5.6 % of the population in 2000 and 2050 respectively. ( because 2050 is a prediction , I don't think its a good idea to include into a ''respectively'' form of sentence)
In Italy, nearly two-thirds of population i.e 61.6 % is formed by young adults in 2000 and this figure will decrease to less than half i.e 46.2 % in 2050.When this data is compared with Yemen it is obvious that population of young adults in Yemen will show an upward trend contrasting to the downward trend in Italy. Interestingly the figure for senior residents almost doubled from 24.1 % in 2000 to 46.2 % in 2050. This trend also negatively correlates with the trend for senior residents in Yemen. Children comprise 14.3 % and 11.5 % of the population in Italy in 2000 and 2050 respectively.
In conclusion it can be said that the figures for population of various age groups in Yemen and Italy show opposite trends to each other in these years. ( you might want to revise your conclusion for validity of your statement. )
Things I learned from you -
Negatively Correlates / Positively Correlates
Nearly two-thirds (i.e talking in terms of proportion)
Contrasting to
Yes I gave data information and analysis together to save time and words . I hope this pattern will suffice my requirement .
Thanks for corrections you made. Even I was not sure to write 2050 with respectively . I could not think of a better conclusion as this was the only thing which was common - reverse trends in yemen and italy in 2000 and 2050
The four pie charts illustrate information regarding the people in Yemen and Italy ( better say the population share of various age groups in Yemen and Italy). They show the change in the ages of populations in 2000 and 2050. ( you might want to rephrase this. Something like - They show the change in share of various age groups in the total population by 2050.)
It is safe to say that Yemen had an impressive 96,4% total in the younger groups in 2000. Only 3,6% of the population were over 60. At the same time, Italy’s senior citizens consist of a respectable 24,1% of the country’s population. The juvenile population gets the 14,3%, quite low compared to the same age group in Yemen. The majority of Italians back in 2000 were between 15-59 years old, taking the 61,6% of the pie chart.
The estimation for 2050 shows that the age of the population in both countries will see a significant change. In Yemen, the 15-59 age group will increase about 10% compared to 2000 and reach 57,3% of the overall population. The youngest population will go down about 13%, while the percentage of the oldest ones will almost be stable. In Italy, the most active part of the population will see a massive decline of about 20% in 2050. The population over 60 will double their percentage of 2000. Also, the Italian youngsters will be part of only the 11,5% of the population.
In conclusion, Italy’s population will grow old and the young population will decline. On the other hand, young Yemenis will see a rapid increase in numbers the future.
Things I learned from you -
Clubbing together the children and Adult population as a part of the presentation.
Good introductory sentence before data analysis
Using superlatives (youngest and oldest) to avoid sounding monotonous.
Thank you! Your essay is excellent from what i've seen. Well done!
The above pie charts represent the population of Yemen and Italy broken down by age in the year of 2000. It also depicts projections for the same populations in 2050. Overall, both countries have very different age distributions and trends, as discussed below.
In Yemen, half of country’s population in 2000 is represented by children from 0 to 14 years. Adults comprise roughly the other half, at 46.3%. It is remarkable that the country shows a negligible share of elderly in 2000, at 3.6%. However, it is predicted that Yemen’s population will show different trends regarding age distribution in 2050. It is expected that children’s rate will drop to 37.0%, while adults’ rate will increase to 57.3%. Elderly will still comprise a minor share, at 5.7%.
In Italy, adults and elderly comprise two thirds of population in 2000. Those with 0 to 14 years represent 14.3% of people. After fifty years, it is predicted that Italy will be an even older country. Children’s rate will decrease by 3.9%, while the adult population is expected to grow older and inflate the elderly’s share of the pie, at 42.3%.
In summary, both countries represent different aspects of the ‘pyramid of ages’. Yemen is a young people country, while Italy has a distribution that is typical of the developed countries, where adults and elderly take a major share.