AC writing task 1. I need help with graphs guys

Post your Task 1 or 2 response and/or read the responses of other students and provide feedback.
Post Reply
dashis
Posts: 24
Joined: Sun Apr 20, 2014 3:22 pm

AC writing task 1. I need help with graphs guys

Post by dashis »

The graphs below provide information on global population figures and figures for urban populations in different world regions.

Summarise the information by selecting and reporting the main features, and make comparisons where relevant.
Image
Image
-----------------------
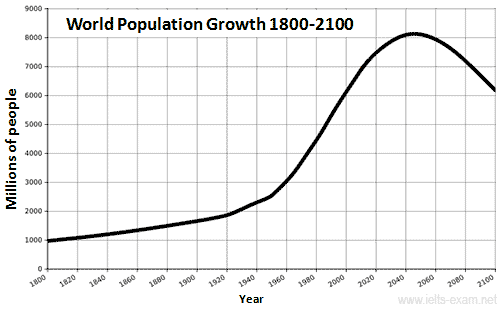
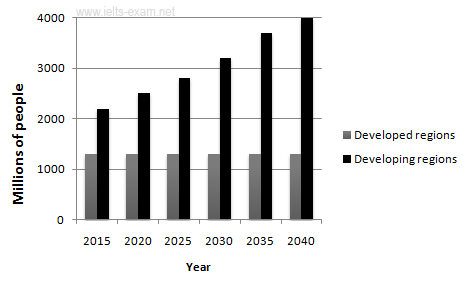
There are two graphs. The first one is a line graph, which shows world's population increase from the year 1800 to a predicted increase in the year 2000. The second one is a bar graph, which foresees urbanization levels in developed and developing regions from year 2015 to 2040.
As an overall trend it is clear that the number of predicted world's population correlates with urbanization levels in developing countries. Meaning that with a higher number of people on this planet, more people from developing regions will decide to live in cities.
In 1800 world's population was around 1 billion people. This number has risen steadily till 1920's, when the population reached 2 billion, and began to increase more sharply. In 1960's population number began to increase dramatically and is predicted to reach a peak of around 8 billion people in 2040's. Afterwards a significant decrease is predicted.
As for world's urbanization levels it is predicted that throughout the 25 year period the number of people living in the cities will remain constant for people from developed regions at around 1.2 billion. However, this number should steadily increase for people from developing regions from around 2.2 billion in 2015 to 4 billion in 2040's.
In conclusion it is clear that with the rise of population more people from developing regions will migrate to cities. It is important for cities to be prepared for such occasion.
------------------------------------------
Is information well summarized ? Is the text not too long? Need comments please
User avatar
Flick
Grammar Checker
Grammar Checker
Posts: 1466
Joined: Mon Apr 21, 2014 10:06 pm

Re: AC writing task 1. I need help with graphs guys

Post by Flick »

dashis wrote:The graphs below provide information on global population figures and figures for urban populations in different world regions.

Summarise the information by selecting and reporting the main features, and make comparisons where relevant.
Image
Image
-----------------------
(There are two graphs. <-- This sentence isn't necessary because we can see that there are two graphs.) The line graph above shows the world's population increase from the year 1800 to a predicted level in the year 2100. The bar graph predicts urbanization levels in developed and developing regions from 2015 to 2040.
As an overall trend it is clear that the predicted population levels correlate with urbanization levels in developing countries. Meaning that with a higher number of people on this planet, more people from developing regions will decide to live in cities. (<-- This is a great explanation. Good job!)
In 1800, the world's population was around 1 billion people. This number has risen steadily until the 1920's, when the population reached 2 billion, and began to increase more sharply. In the 1960's, population levels began to increase dramatically and is predicted to reach a peak of around 8 billion people in the 2040's. Afterwards a significant decrease is predicted.
As for urbanization levels, it is predicted that throughout the 25 year period the number of people living in cities will remain constant for people from developed regions at around 1.2 billion. However, this number should steadily increase for people from developing regions from around 2.2 billion in 2015 to 4 billion in the 2040's.
In conclusion it is clear that with the increase in population, more people from developing regions will migrate to cities. It is important for cities to be prepared for such an event.
Good job. Your initial summary was spot on. The way you described both graphs was clear and easy to imagine.
dashis
Posts: 24
Joined: Sun Apr 20, 2014 3:22 pm

Re: AC writing task 1. I need help with graphs guys

Post by dashis »

Thanks mate! Will look into your suggestions
Post Reply